I have a bad habit of doing complicated things once, and then having to reinvent the wheel the next time I attempt something similar. I know enough code to be a frustration to myself and others, so I keep forgetting things I used to know. I’ve just finished a paper (or a draft of a paper) for IAMCR2016, in which I collected and analysed 30-odd Twitter feeds over three months worth of data, something like 120 000 Tweets. So, here is what I did, and what I learned about doing it. The actual paper is here.
To collect the actual Tweets, I used M Hawksey’s Twitter Archiving Google Sheet (TAGS), available here.
I started collecting everything from the #oscarpistorius and #oscartrial hashtags, but the sheets have a limit of around 50 000 tweets, and were crashing often. I used various lists and reading/checking to gather the names of thirty journalists who were Tweeting the trial. I set up a separate TAGS sheet for each one, limiting the search by using from:username in the search field. There are various search operators you can use, there’s a list here.
I set the sheets to update every hour, and kept an eye on them. It’s fortunate that Twitter allows you to collect Tweets from up to seven days ago, so I had a few days from the start of the trial to get my searches and sheets in order.
I had to create several Twitter accounts to use for the OAuth keys, I kept getting locked out for overusing the free API. TAGS version 6.0 doesn’t seem to need OAuth, or it’s fully scripted, but I would worry slightly about being locked out. The sheets crashed a few times, hitting the spreadsheet limit, so I had to create multiple sheets for some users. At the end I had around fifty sheets. TAGS is very easy to use, and doesn’t need a server to run, but the limit of working with Google Sheets is a bit frustrating. Setting everything up was very slow.
Once I had the data, I bulk downloaded everything, and ended up with Excel files on my desktop.
I used MS Access for the main analysis. I know a bit of SQL from way back, and Access is pretty readily available. I imported all of the sheets into a single table, called archive. I had already created a separate table called users, which contained information about each account. The table structure for the archive table was pretty much determined by Twitter’s data structure.
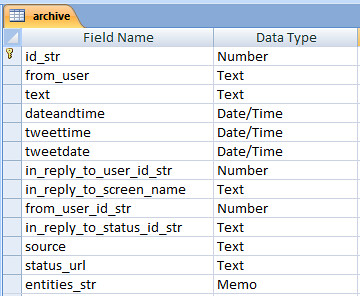
Data structure. The Tweetdate and Tweettime fields were added later.
I used Access’s inbuilt tools to remove duplicates from the archive. TAGS has a function to do this in the Google Sheet, but the files were so large the script was battling, so I opted to do it once I had a full archive.
Twitter provides a date/time stamp for all Tweets, in a single field, formatted “Fri Sep 12 11:56:48 +0000 2014”. I split this field into two new fields, one date, one time, by copying the field and then using Access’s field formatting to strip the time and date out respectively. I then filtered all tweets by dates on which the trial was in session (based on this Wikipedia article, I confess, but I did check that this tallied with the data I had). I also filtered the Tweets by time, limiting the archive to time between 9am and 5pm, South Africa times (Twitter’s timestamp is universal time). I then read through the feeds, and removed any days in which it was clear thejournalist was not in the courtroom. I also removed a large number of Tweets from the official news organisation accounts (in retrospect, I wouldn’t include this if I did it again) that were not about the trial. I initially intended to filter by hashtags, but hashtag usage was inconsistent, to say the least, so this didn’t work.
That left me with around 80 000 Tweets to play with. I did some basic select queries to pull out volume of Tweets per day, and per user per day, pasted into Excel and made charts.
I then pulled the text of tweets, converted to json using this tool and then used Marco Bonzanini’s excellent tutorial on mining tweets with Python and the NLTK to extract hashtags from the corpus.
Mentions and retweets are harder to analyse. Twitter does store replies as metadata, but not retweets. The NLTK can’t work with two-word terms (or I couldn’t work out how to do this), so they can’t be counted. I replaced all occurrences of “RT @” with “RTAT” (after first checking whether that string occurred anywhere else within the corpus) and then used the NLTK to analyse all terms starting with RTAT, to extract most popular retweetees.
It was simpler to extract 24 separate JSON files for each user, and run the same analysis again than to iterate the code (my Python skills are woefully bad), so I did that.
Links to images are stored in the “entities” metadata with the media tag, but this field is too long to be stored as text in Access, so it can’t be easily analysed – it can be filtered, but not queried, for reasons I don’t understand. I filtered by the media tag, and exported to CSV where I used Excel to select a random set of images to analyse. These had to then be manually viewed on the web to conduct the analysis.
Links were likewise extracted from the metadata by filtering, exporting to Excel and using Excel’s matching tools to extract the actual URLs. Links are shortened in the text, but in most cases the meta tag retains the full URLs. In some cases, the URL in the metadata is again shortened, and I used Python to extract the full URLs and then updated the table with the correct URL. These were then analysed in the database, and tagged by type manually. (I could have done this automatically, but there are times when doing something manually is quicker and simpler than automating the code).
Queries were used to extract numbers of various occurrences and exported to Excel to generate graphs and charts.
I know there are better and more efficient ways to do all of this, but focusing on what works is what matters to me most of the time.